Spatial climatic contributions
Source:vignettes/climniche-contributions.Rmd
climniche-contributions.RmdWhich climatic variables account for movement towards or away from the species’ average climate, and does their contribution vary geographically? The analysis partitions the change in squared distance from the reference centre among the fitted climatic variables at each location.
Cell level contributions
The object spatial_fit is the European anchovy fit
constructed in the Mediterranean
example. Contributions are restricted to cells with positive current
reference weight.
contribution <- climniche_dominant_contribution(
  spatial_fit,
  scope = "current"
)

summary(contribution)
head(contribution[["table"]])
Let \(z_{0i}\) and \(z_{1i}\) be the centred current and future climate vectors for cell \(i\), and let \(A\) be the fitted metric matrix. The contribution of variable \(j\) is
\[ V_{ij} = z_{1ij}(A z_{1i})_j - z_{0ij}(A z_{0i})_j, \]
so that
\[ \sum_j V_{ij} = r_{1i}^2 - r_{0i}^2 = R_i(r_{1i} + r_{0i}), \]
where \(r_{0i}\) and \(r_{1i}\) are current and future distances from the reference centre, and \(R_i\) is Niche Distance Shift. Positive contributions increase squared distance and negative contributions reduce it. The dominant variable has the largest \(\lvert V_{ij}\rvert\). Its dominance share is
\[ H_i = \frac{\max_j \lvert V_{ij}\rvert} {\sum_j \lvert V_{ij}\rvert}. \]
Values near one indicate that a single variable accounts for most of the total absolute contribution at that cell. Equal largest contributions are retained as ties.
Mediterranean pattern
variable_labels <- c(
  temperature_mean = "Mean temperature",
  temperature_range = "Temperature range",
  salinity_range = "Salinity range",
  ph_mean = "Mean pH",
  sea_water_speed_mean = "Mean current speed",
  sea_water_speed_range = "Current speed range"
)

plot_climniche_dominant_contribution(
  contribution,
  type = "both",
  variable_labels = variable_labels,
  legend_variables = names(variable_labels),
  study_region = mediterranean_boundary,
  degree_labels = "hemisphere"
)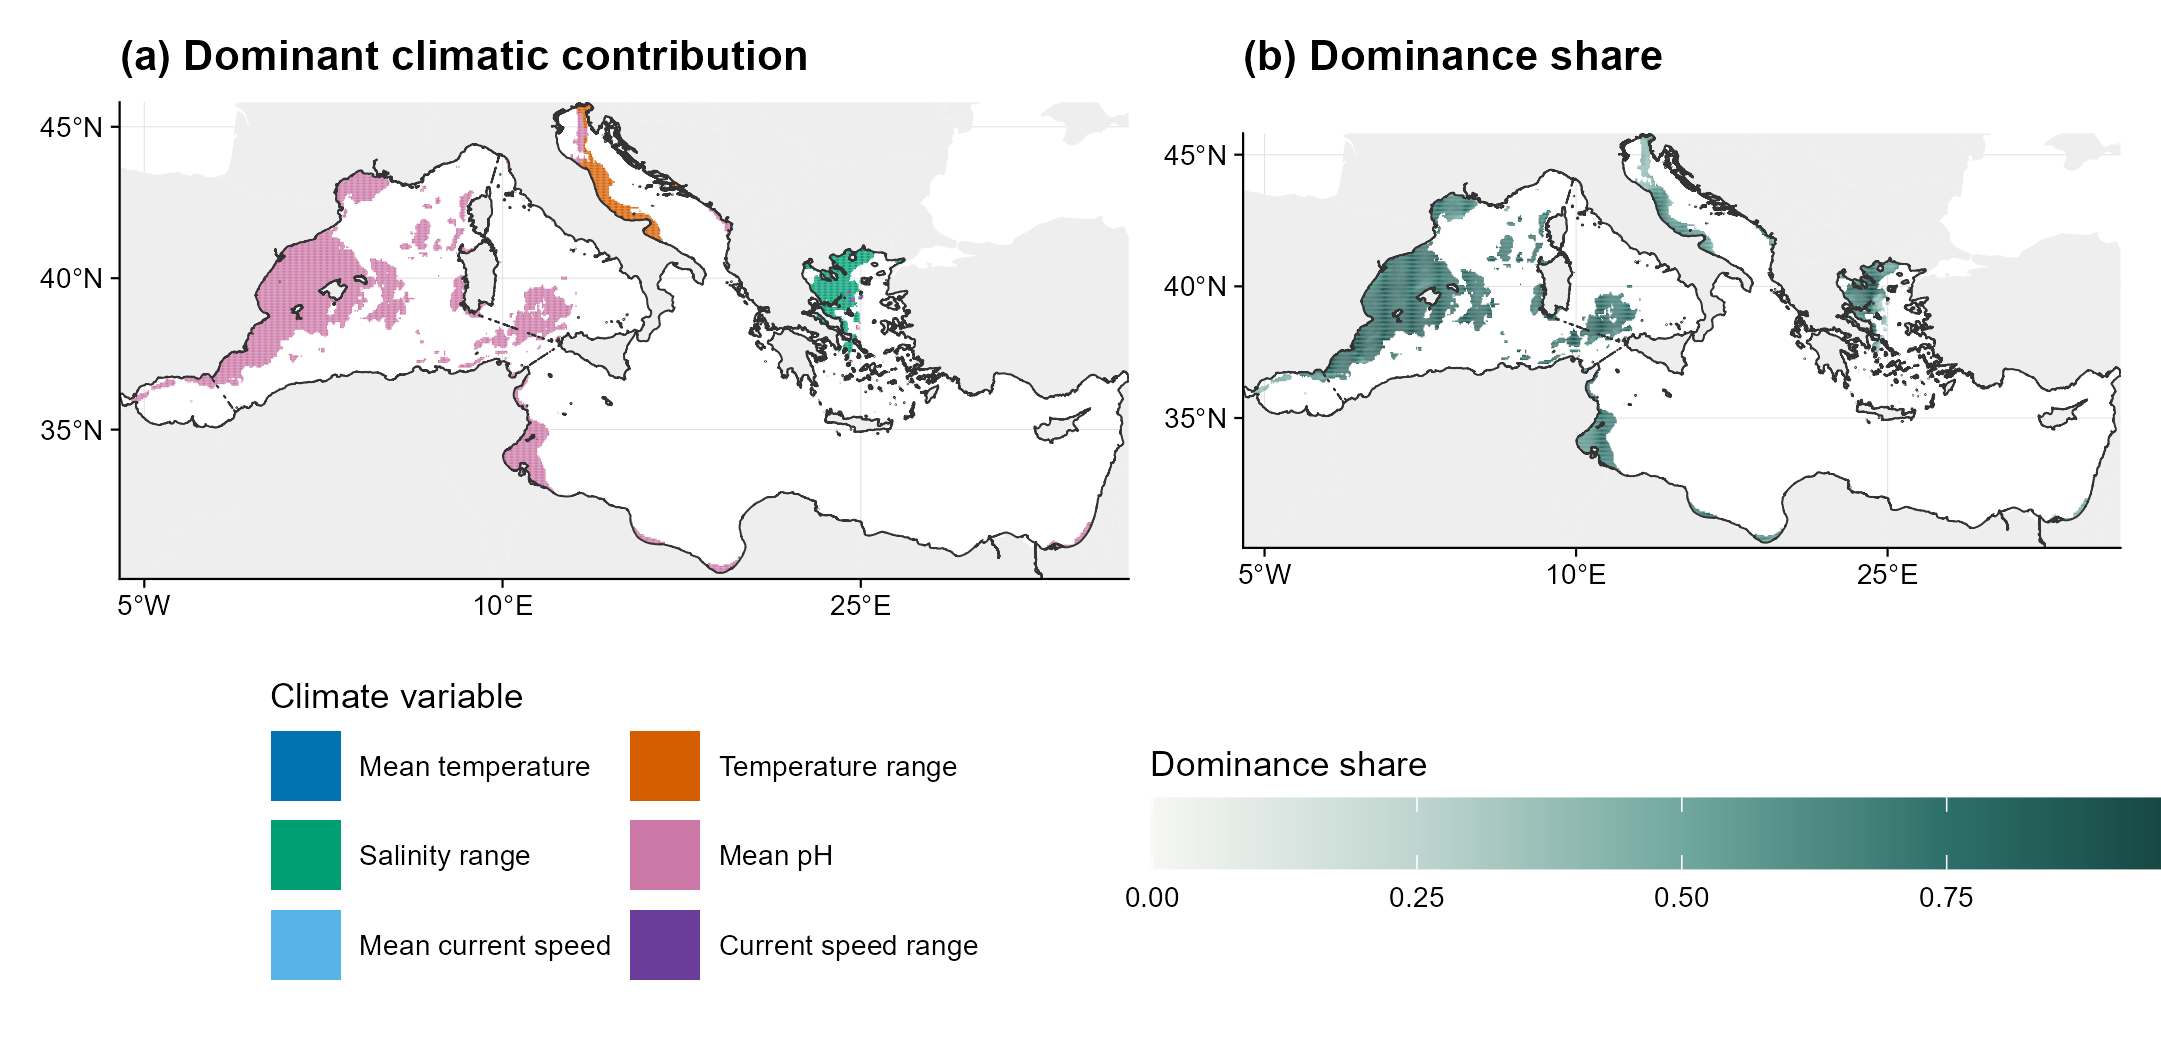
Panel (a) maps the variable with the largest absolute contribution and retains all six fitted climate variables in its legend. Panel (b) maps the dominant variable’s share of the total absolute contribution at the same cell. Mean pH has the largest absolute term in most cells with positive anchovy reference weight. Temperature range and salinity range have the largest term in smaller, geographically distinct areas.
The weighted dominance frequency is the reference-weighted fraction of cells with non-zero contribution for which a variable is uniquely dominant.
| Climate variable | Mean absolute share | Weighted dominance frequency |
|---|---|---|
| Mean pH | 0.683 | 0.827 |
| Temperature range | 0.131 | 0.071 |
| Salinity range | 0.107 | 0.100 |
| Mean temperature | 0.041 | 0.000 |
| Current speed range | 0.029 | 0.002 |
| Mean current speed | 0.009 | 0.000 |
These contributions describe climatic distance change, not SDM predictor importance. With a non-diagonal metric matrix, each contribution also includes the variable’s allocated cross-variable terms.